.png)
Through our work as an Owner’s Engineer, Pure Power has extensive experience evaluating, inspecting, and commissioning PV power systems. While I-V curve tracing is an essential tool in these efforts, it is not necessarily the best tool for every job. Moreover, some common pass-fail metrics involving I-V curve tracing may not be adequate to achieve the intended result.
.png?width=436&height=245&name=Optimizing%20I-V%20Curve%20Tracing%20Activities%20-%20Post%20(1).png)
Here I provide a brief overview of the benefits of I-V curve tracing and share insights regarding its strategic use for project commissioning and inspection purposes. In the process, I highlight common myths regarding I-V curve tracing that may inadvertently lead to inefficiencies or ineffectiveness during project delivery.
Benefits of I-V Curve Tracing
An I-V curve tracer works by sweeping a load across the operating range of a PV power source. The tool simultaneously measures the output current and voltage at different points across the operating range of the source circuit or module. By capturing a representative set of operating points between Isc and Voc, the tool is effectively able to outline or trace the entire I-V curve.
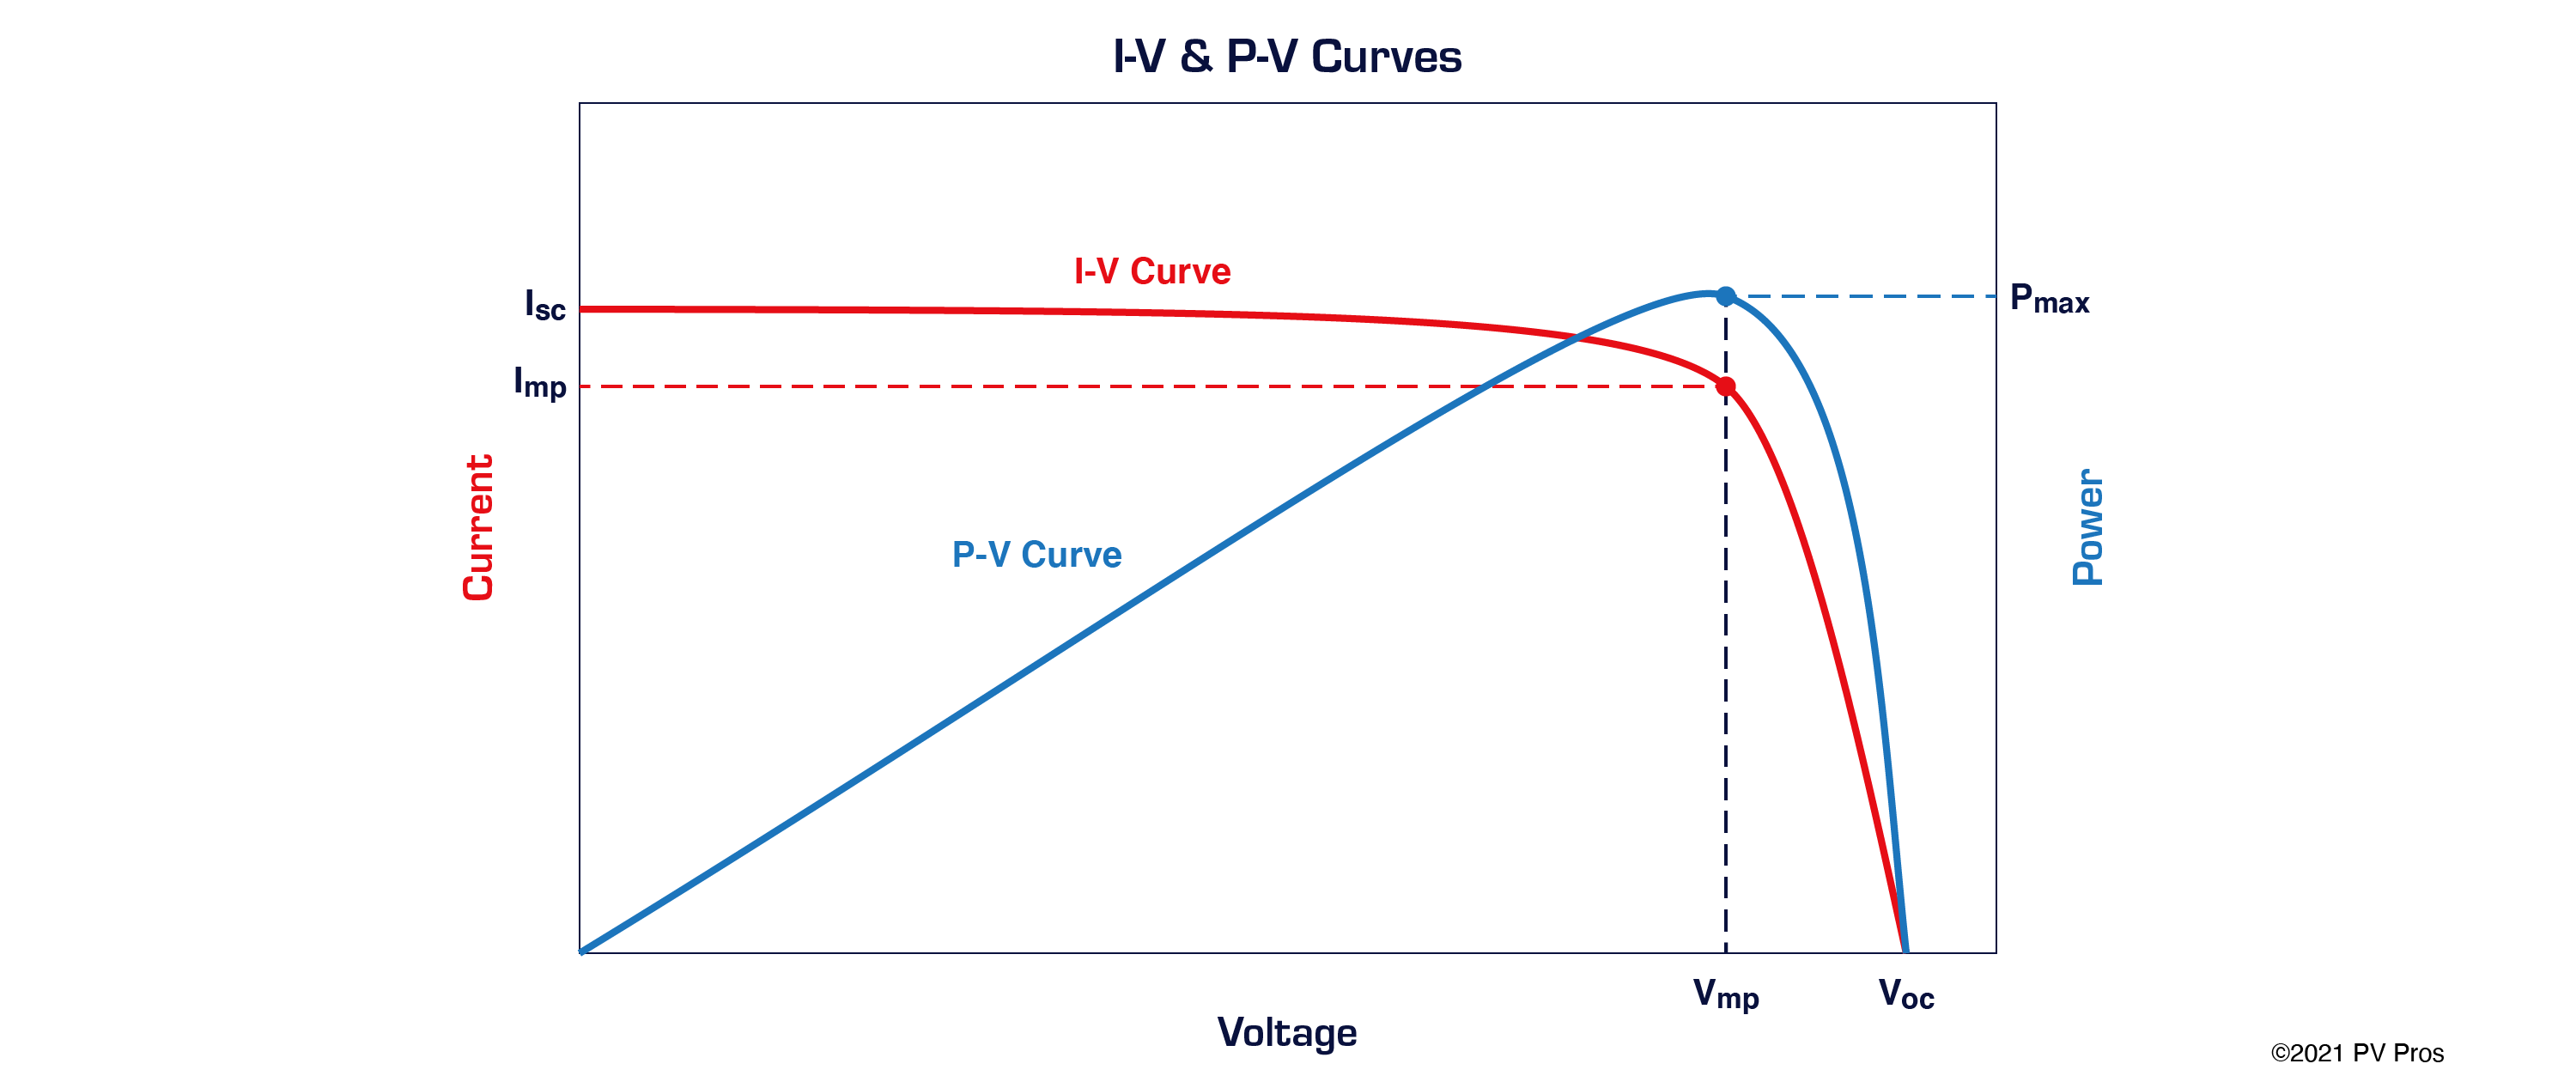
I-V curve tracers are indispensable as a diagnostic tool because of this ability to effectively visualize all of the current and voltage operating points of a PV source. The tool not only captures essential static electrical test characteristics, such as Isc and Voc, but also captures important dynamic operating characteristics, such as Pmp. The overall shape of the I-V curve, meanwhile, reveals whether the PV source is healthy or impaired. Moreover, if a measured I-V curve differs substantially from the predicted curve, the nature of the deviation will determine or provide clues regarding the probable failure mode.
By virtue of these capabilities, I-V curve tracers are ideally suited for identifying the symptoms of underperformance in PV power systems. No other piece of electrical test equipment provides as much relevant information about the operation and health of a PV module or string. Every PV system commissioning agent or operations and maintenance (O&M) technician should have access to an I-V curve tracer and know how and when to use it safely and effectively.
I-V Curve Tracing for Project Commissioning
Most contract documents call for I-V curve testing of each PV source circuit during project commissioning, which requires boots-on-the-ground resources. While statistical sampling strategies are sometimes employed in very large utility-scale projects, comprehensive I-V curve tracing is a best practice for project acceptance and benchmarking.
Capturing I-V curve traces during project commissioning allows project stakeholders to quickly identify and remedy problems or deficiencies. In addition to serving an important quality assurance and quality control function, I-V curve tracing prior to the commercial operation date (COD) also establishes the foundation of a permanent record regarding plant performance.
I-V curve traces conducted during commissioning establish a highly granular performance baseline for a new PV asset. This basis of comparison is invaluable during project operations for understanding plant performance, health, and degradation over the life of the system.
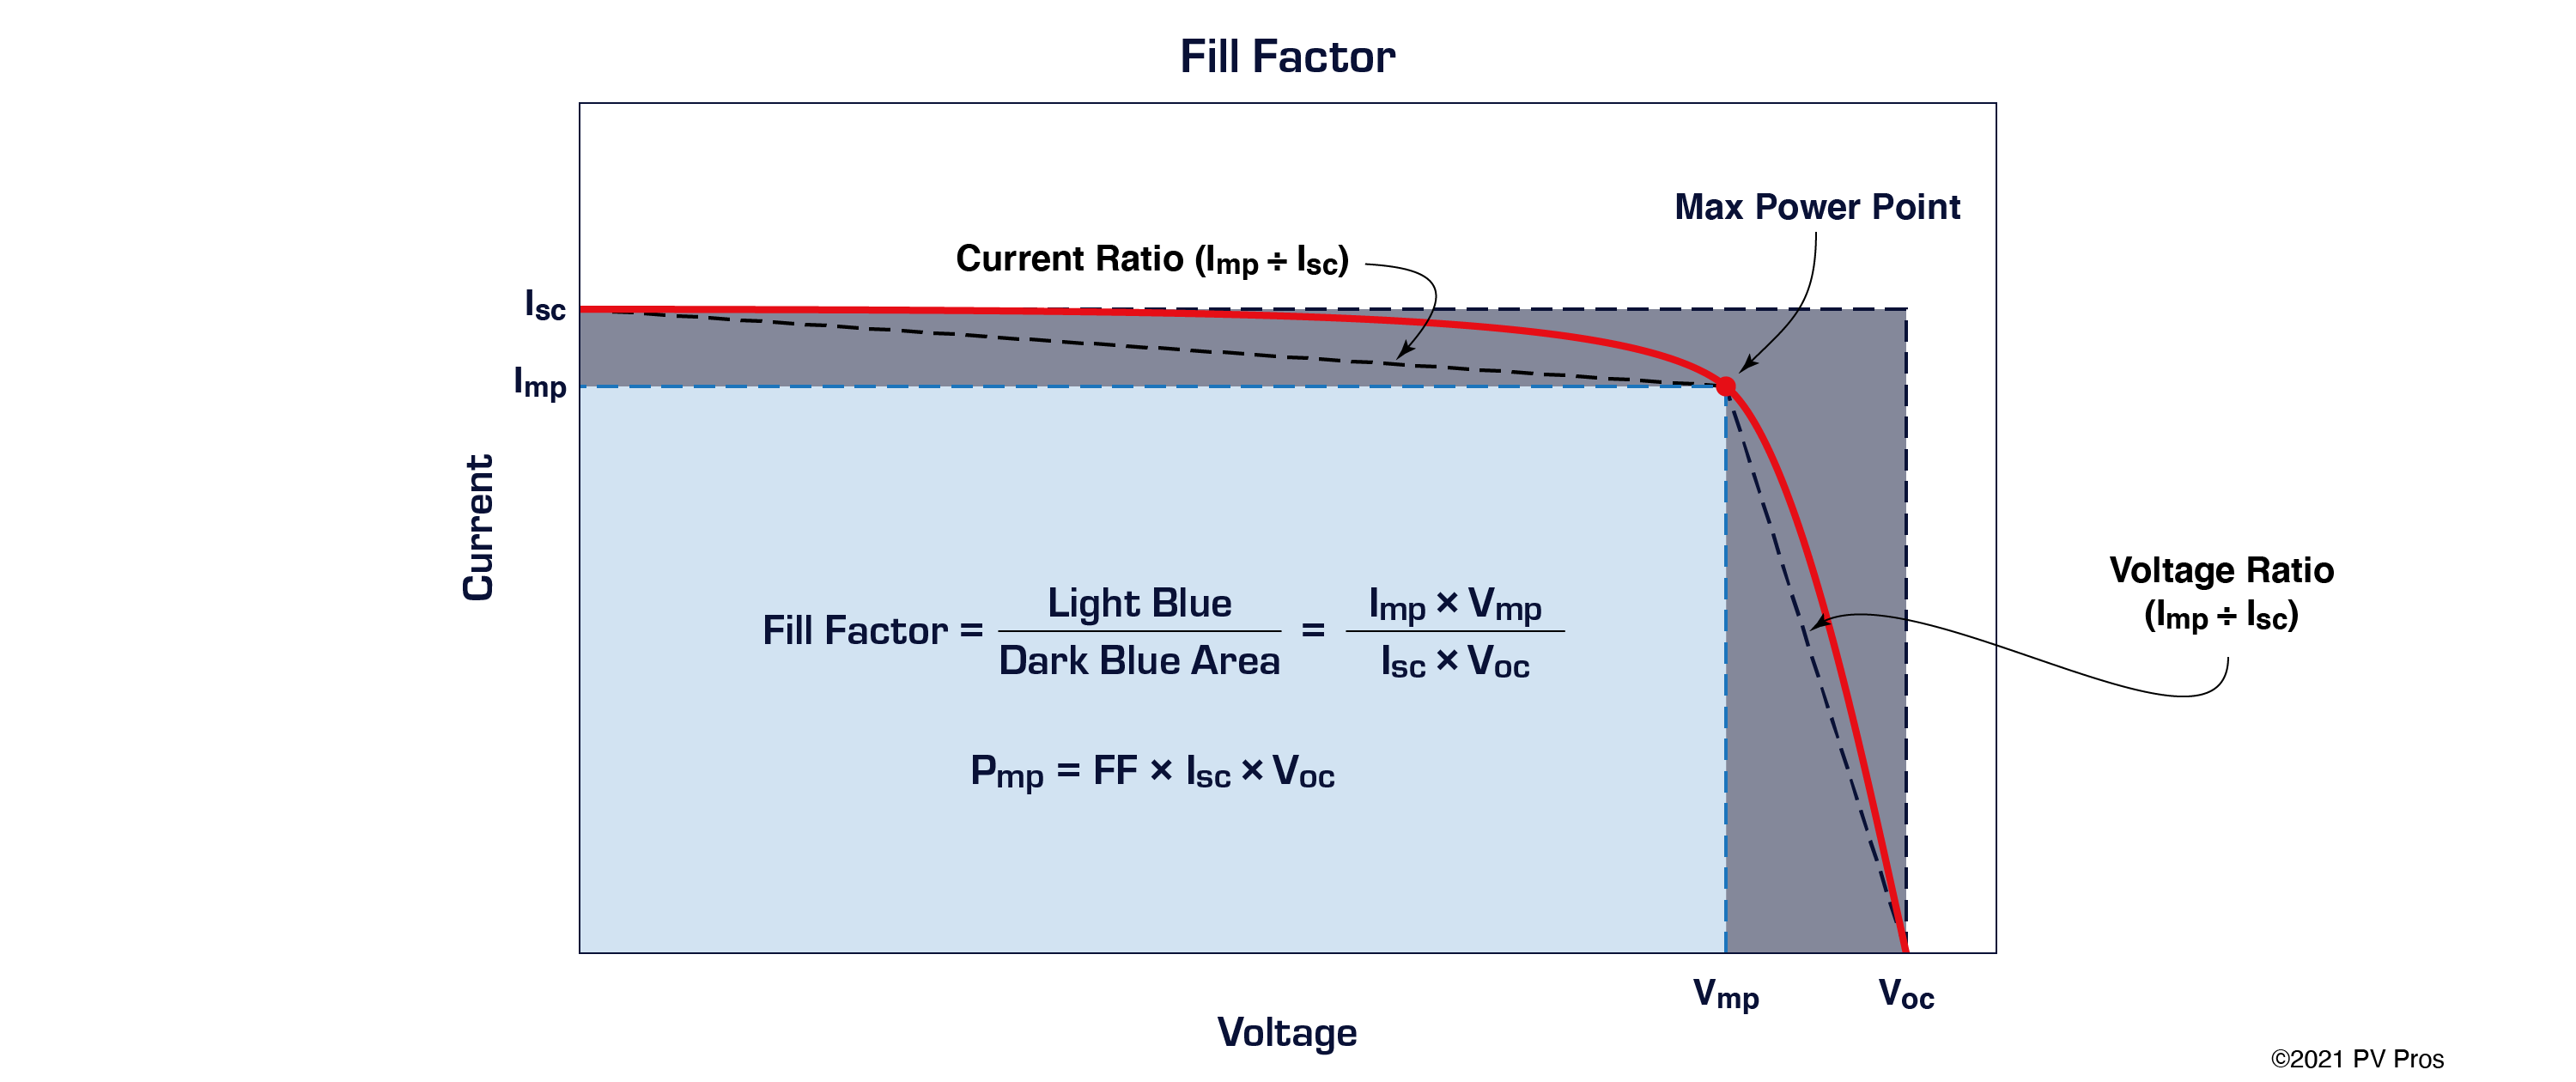
Pass-Fail Criteria. Fill factor is the most common contractual pass-fail metric for I-V curve tracing. This metric expresses the squareness of the I-V curve and is calculated by dividing the Pmp by the product of the Isc and Voc. Contractually, the pass-fail threshold for fill factor is typically 70%. In this scenario, strings with a fill factor below 70% fail to meet the contractual requirements and are flagged for investigation and corrective action; strings with a fill factor of 70% or greater are accepted as having passed inspection.
Myth #1: The pass-fail criteria used during project operations are an adequate screen for issues during project commissioning.
As a best practice, we recommend that owners also use performance factor as a secondary screening criterion during project commissioning. Performance factor describes how well a measured I-V curve agrees with a predicted curve after normalizing for STC. Performance factor is expressed as a percentage and determined by dividing measured Pmp by predicted Pmp.
Generally speaking, a performance factor greater than 90%, coupled with a normal curve shape, is an acceptable pass-fail metric for an operational PV power system. During project commissioning, however, when PV modules with a positive power tolerance are newly installed and reasonably unsoiled, a 90% performance factor allowance is not adequately rigorous as a screen for defects, as it will allow some potential issues to go undetected.
In order to flag all probable deficiencies during commissioning, Pure Power recommends that owners and financiers establish a performance factor of 95%, after normalizing for STC, as secondary pass-fail criteria. By using a 95% performance factor as filtering criteria, it is possible to isolate and scrutinize secondary issues that may affect string-level performance. Upon further investigation, this more rigorous pass-fail screen may reveal subtle deficiencies such as modules that are not producing to the manufacturer’s warranty. Alternatively, if the I-V curve shape and other performance metrics check out, the owner’s engineer may determine that a performance factor greater than 90% but less than 95% is acceptable.
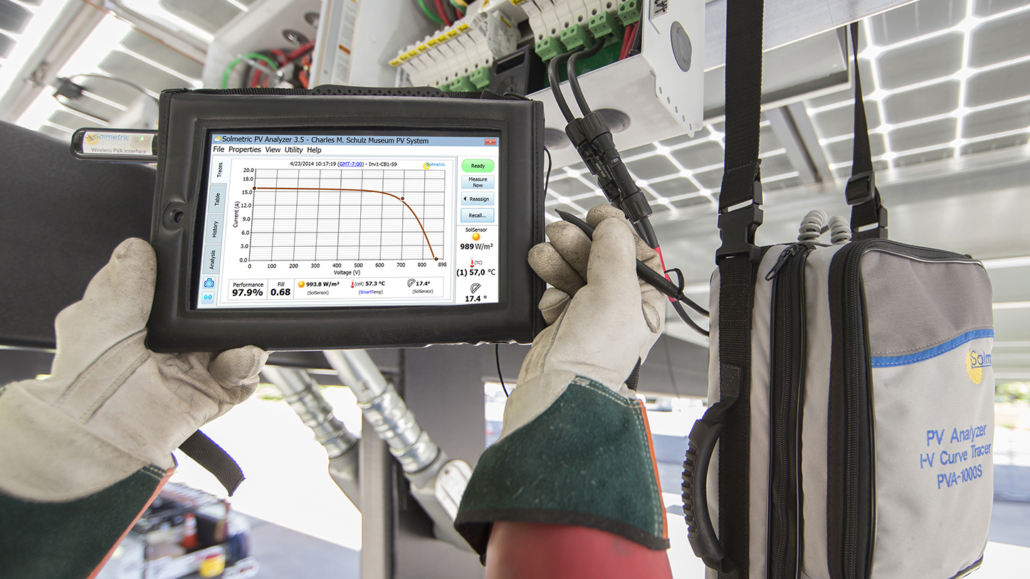
Courtesy Solmetric
I-V Curve Tracing During Project Operations
After the commencement of project operations, I-V curve tracing is best used in support of more resource-efficient inspection methodologies.
As compared to using boots-on-the-ground resources to I-V curve trace an entire PV power plant, aerial inspections are faster, cheaper, and produce more predictable results. In some cases, piloted aircraft can inspect an entire PV power system in less than a minute with a single flyover. The resulting digital record is very easy to interpret, as compared to I-V curves captured under changing weather conditions at different times of the day or week. Last but not least, aerial inspections reduce exposure to electrical hazards.
Myth #2: Periodic I-V curve tracing is the first line of defense for maintaining operational solar project performance.
Operational Efficiencies. Solar project O&M activities are most efficient when owners rely on aerial imaging for bulk inspection purposes. Based on the results of these aerial inspections, asset managers and O&M providers can identify the specific locations in need of corrective actions. Moreover, it is possible to prioritize these efforts based on performance impact, perhaps resolving issues at the inverter level before moving to the string level, module level, and finally the sub-module level.
In this context, I-V curve tracing is really the third line of defense for maintaining solar project performance during operations. The first step for maintaining plant performance is to conduct periodic aerial inspections. The second step is to prioritize and conduct investigations based on the resulting aerial images. Based on the outcome of these investigations, the third step is to use I-V curve tracing in support of troubleshooting activities or a warranty claim. In an operational system, in other words, I-V curve tracing is most effective when it is conducted selectively and strategically on an as needed basis, rather than indiscriminately as a bulk inspection tool.


.png)